
Short answer
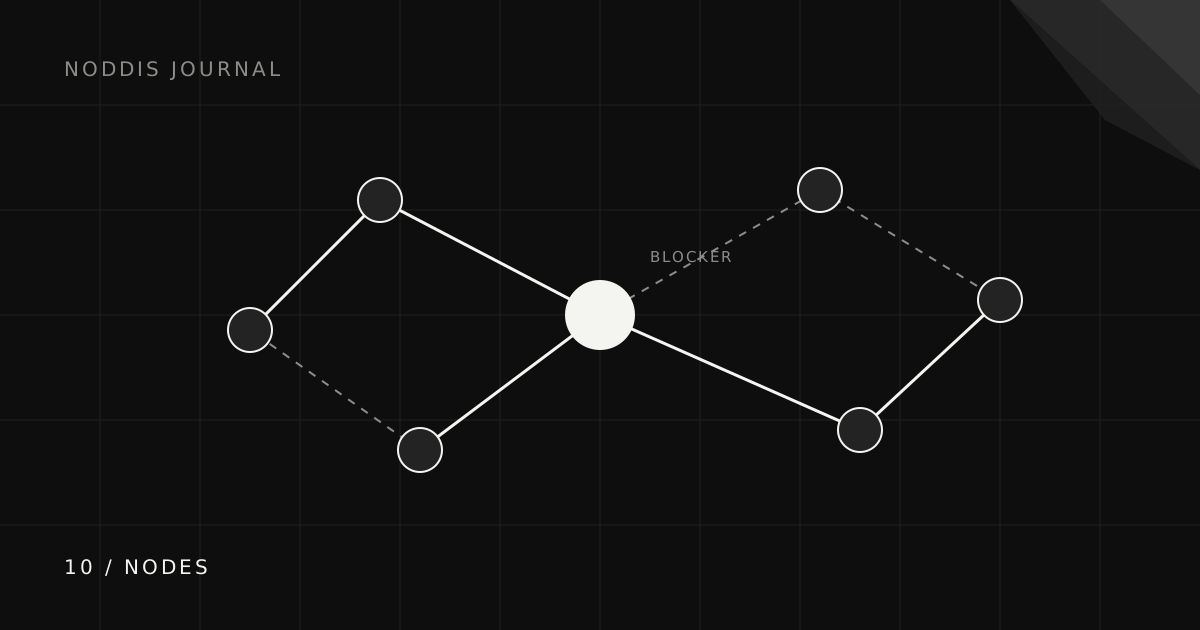
A project map makes stored relationships easier to inspect: tasks connected to notes, files, people, or other work. Noddis Nodes builds a graph from available project records and explicit connections. Read the labels and verify dependencies in the tasks; a visual connection alone does not prove that one task blocks another.
What do task lists hide?
Task lists hide the relationships between tasks. A list is excellent at answering “what is there to do?” and hopeless at answering “why is nothing moving?” Each item looks independent, so a single approval that seven tasks depend on looks exactly as important as a typo fix.
That is why projects so often stall with no obvious culprit. Every individual task is reasonable. The problem is the shape of the connections between them, and a list flattens that shape out of existence.
When is a visual project map worth opening?
A visual project map is worth opening when a project feels stuck, when a date might move, or when work changes hands:
- A project feels stuck but nothing is technically late. Look for a node with a lot of arrows pointing at it.
- Someone asks what happens if a date moves. Follow the dependencies forward to see what else shifts.
- You are handing a project to someone else. The map explains the structure faster than any written brief.
- Kicking off something complex. Seeing the connections early exposes the riskiest dependency before it bites.
How do you read a project map?
Start with the record you are investigating, then inspect the labels on its connections. A note attached to a task supplies context; an explicit task dependency describes an ordering constraint. They should not be interpreted the same way.
A heavily connected item may deserve attention, but connection count is not a priority score. Likewise, a record with no connections may be new or independent rather than unnecessary. Confirm the next action with the person doing the work.
How does Noddis Nodes work?
Nodes displays the records and relationships available for a connected project, including tasks, notes, files, and people. It uses stored relationships, and you can add explicit connections where useful. Read the relationship label: an association is not necessarily a task dependency, and the graph cannot know about an approval you have never recorded.
Free includes Connected Intelligence for one selected project; Pro extends it across your authorized projects. Use the map to investigate a blocker, then confirm the next action in the task itself.
Pair the graph with the project task list. Use Drift for scope additions and Follow-Up for recorded commitments; neither is a substitute for checking what the particular connection means.
How is a node map different from a Gantt chart?
A Gantt chart is organized around time: it shows when things are scheduled and how long they take. A node map is organized around relationships: it shows what is connected to what, regardless of dates. Gantt charts are useful for planning a schedule; node maps are useful for understanding a structure, especially in client work where dates move constantly and the dependencies are what really matter.
Common questions
What is a project dependency map?
A visual diagram showing how the tasks in a project depend on one another, so you can see which items must finish before others can start and where a single delay will ripple.
How do I find what is blocking my project?
Map the dependencies and look for a node with many incoming connections or an explicit blocker relationship. Clearing that one item usually releases several others.
Do I have to draw the Noddis Nodes map myself?
The graph is generated from available project records and stored relationships. You can add explicit connections. Noddis cannot infer a real-world dependency that has never been captured, so check the labels and underlying tasks.
Is visual project management better than lists?
They do different jobs. Lists are best for doing the work; maps are best for understanding why work is stuck or how a change will spread. A good tool gives you both from the same data.

Katleen is the founder of Noddis. She runs client projects through her app studio, 693 Labs, and builds Noddis around the problems that work creates.
Last reviewed . Feature details reflect Noddis at the time of review.